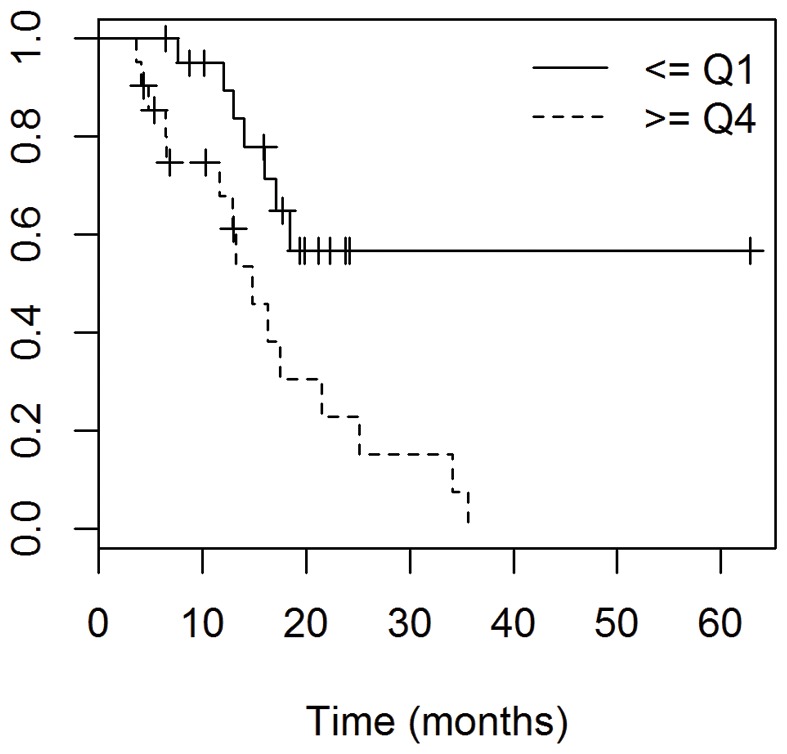
Figure 2. Kaplain-Meier analysis comparing overall survival of patients with the smallest tumors in the bottom quartile (Q1) and patients with the largest tumors in the top quartile (Q4), based on GTV1 volumes.

Median OS for patients with the smallest tumors (Q1) was 52.3 months compared to 16.3 months among patients with the largest tumors, P = 0.006.
