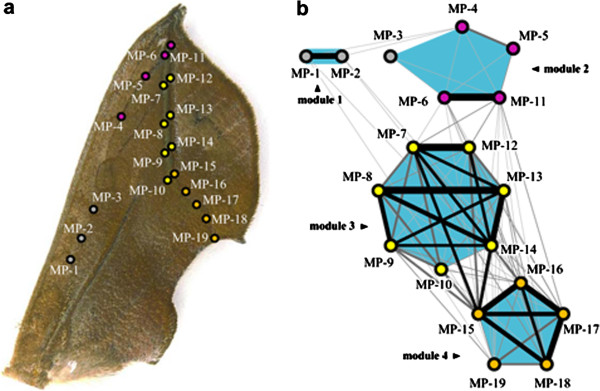
Figure 4.

Morphological correlation network in the O. excavata wing pattern. (a) Measurement points were set on the O. excavata leaf wing pattern. (b) The correlations among the measurement points were quantified and visualized as a form of network. In this correlation network, the nodes represent the measurement points, whereby the links represent correlations between the measurement points above the threshold level (Rv coefficient = 0.2). In this correlation network, the RB method detected four modules (light blue areas). Because the RB method finds weighted solutions, the most frequent solution (67.6% occurrence frequency of the 10,000 trials) is shown. Larger correlation coefficients are shown by thicker edge widths and blacker coloration of links. The measurement points within modules are shown in the same colors as the measurement points in Figure 4a.
