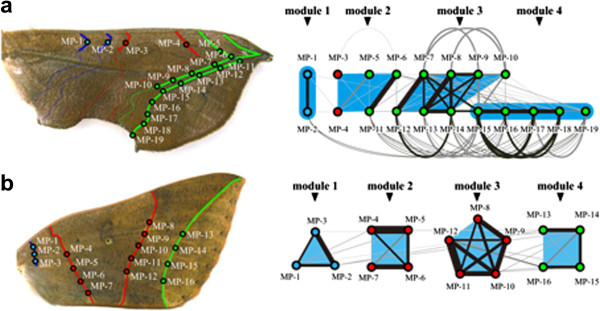
Figure 5.

Comparison between the correlation networks of the leaf and nonmimetic patterns. From the correlation networks, the RB method detected modules (light blue areas). (a) Correlation network (Rv coeff. threshold level = 0.2) of the O. excavata wing pattern is re-plotted based on the ground plan. The detected modules correspond to the NGP symmetry elements in a complex manner. (b) Correlation network (Rv coeff. threshold level = 0.2) of the T. juno wing pattern is shown on the ground plan. The detected modules regularly correspond to the NGP symmetry elements in a one-to-one manner. The constituent elements of the wing patterns and the measurement points are represented by the same colors as in Figure 3. Larger correlation coefficients are shown by thicker edge widths and blacker coloration of links.
