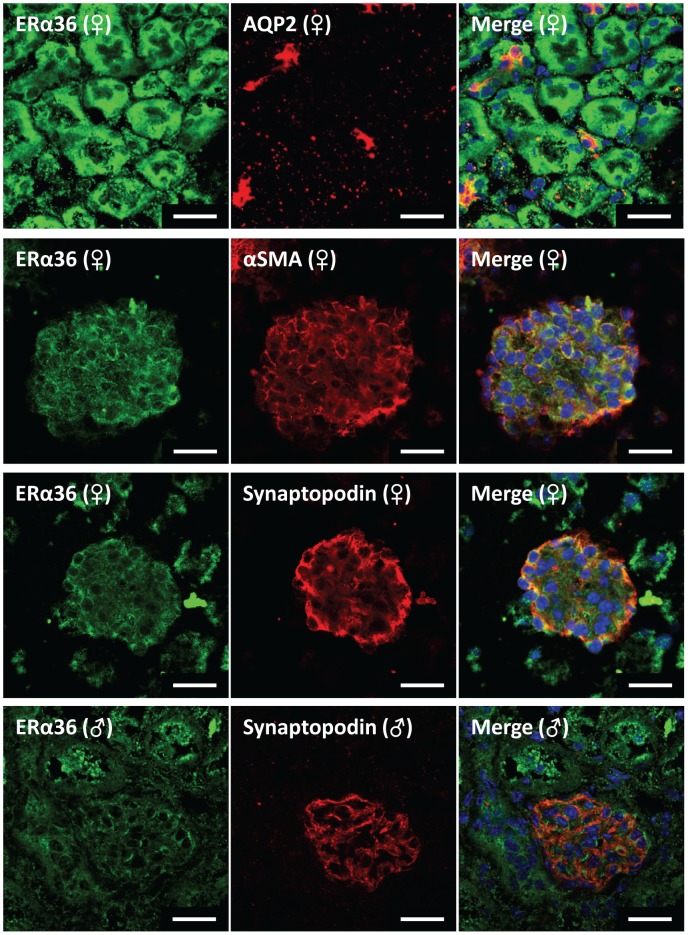
Figure 6. Representative immunofluorescence images localizing ERα36 in mouse kidney.
Green fluorescence represents ERα36 in all images. Red fluorescence represents cell specific markers for co-localization (collecting duct marker, aquaporin 2; vascular smooth muscle & mesangial cell marker, α-smooth muscle actin; podocyte cell marker, synaptopodin). Nuclei are stained blue with DAPI. Scale bar = 20 µm.

