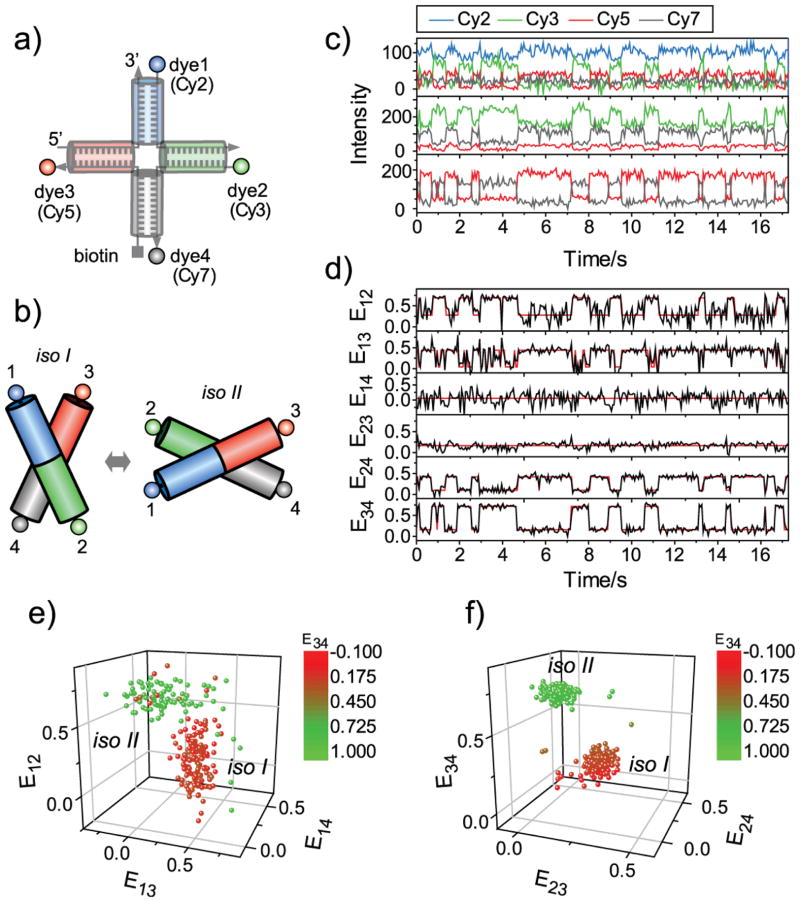
Figure 2.
Holliday junction dynamics observed via single molecule four-color FRET. a) Labelling scheme. b) A conformational dynamics model of the Holliday junction. c) Representative fluorescence intensity time traces at blue (top), green (middle), and red excitations (bottom). Fluorescence signals of Cy2, Cy3, Cy5 and Cy7 are colored in blue, green, red and gray, respectively. In the top panel, Cy2 signal is vertically shifted for clear visualization. d) FRET efficiency time traces. The six FRET efficiencies (black lines) were calculated from the data in c) following the method described in Supporting Information. Red lines are the most probable FRET trajectories generated by Hidden Markov Modeling. e) Three-dimensional distribution of E12, E13, and E14 of d). f) Three-dimensional distribution of E34, E23, and E24 of d). To make a connection between e) and f), each data point in the plots is color-coded based on E34.

