Figure 2.
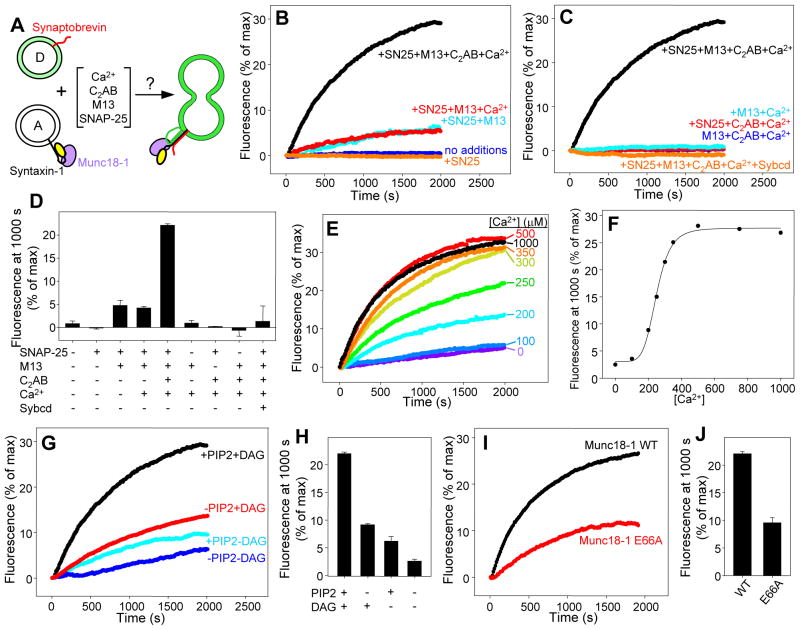
Requirement of Munc13 for lipid mixing of syntaxin-1-Munc18-1-liposomes with synaptobrevin-liposomes. (A) Diagram summarizing the lipid mixing experiments, which were performed with acceptor liposomes containing syntaxin-1-Munc18-1 and donor liposomes containing synaptobrevin and NBD-lipids quenched by rhodamine-lipids. (B,C) Traces showing the lipid mixing observed in the presence of SNAP-25, Munc13-1 C1C2BMUN (M13), synaptotagmin-1 C2AB fragment (C2AB), synaptobrevin cytoplasmic domain (Sybcd) and/or 0.5 mM Ca2+ in various combinations. The y axis represents NBD fluorescence normalized to the maximum fluorescence observed upon detergent addition. (D) Quantification of the results obtained in the experiments of (B,C). (E) Lipid mixing observed in the presence of SNAP-25, C1C2BMUN and C2AB fragment as a function of Ca2+ concentration. (F) Plot of the normalized NBD fluorescence intensity at 1000 s as a function of Ca2+ observed in (E). (G,H) Dependence of lipid mixing on the presence of DAG and/or PIP2 in the acceptor syntaxin-1-Munc18-1 liposomes (G), and quantification of the results (H). (I,J) Lipid mixing obtained with acceptor liposomes that contained syntaxin-1 bound to WT or E66A mutant Munc18-1 (I) and quantification of the results (J). In (D, H and J), bars represent averages of the normalized NBD fluorescence observed after 1000 s in repeated experiments performed under the same conditions. Error bars represent standard deviations.

