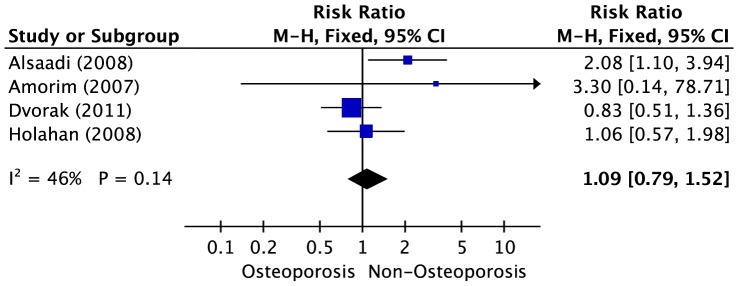
Figure 5. Forest plot of studies with dental implant failure risk for patients with osteoporosis versus non-osteoporosis.

The combined Relative risks (RR) and 95% confidence intervals (CIs) were calculated using the random-effects model.

The combined Relative risks (RR) and 95% confidence intervals (CIs) were calculated using the random-effects model.