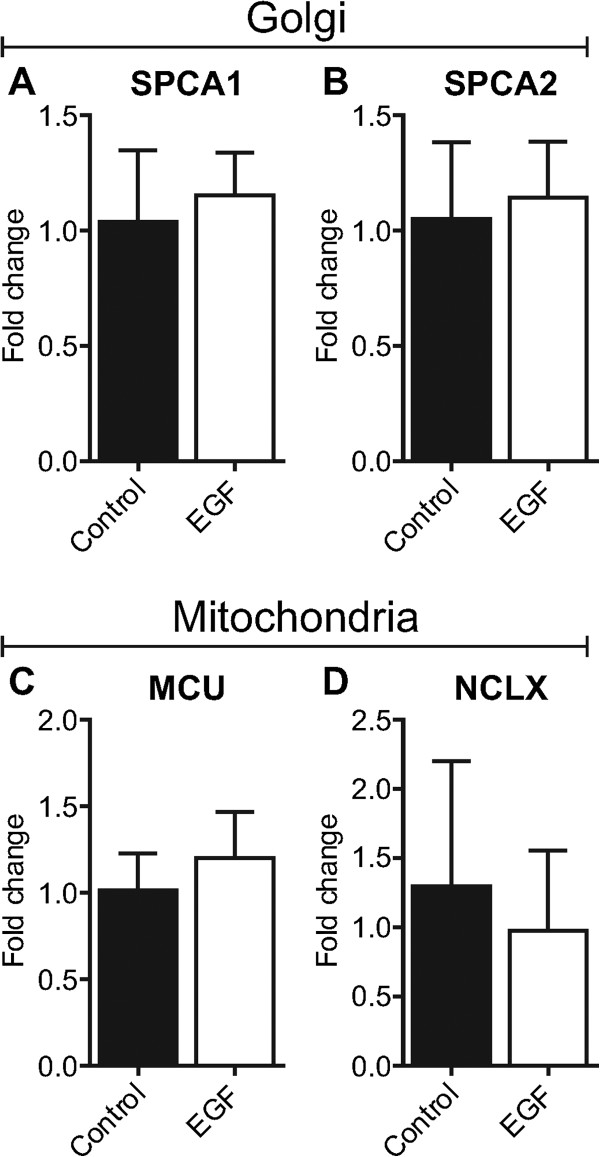
Figure 2.
Assessment of Golgi and mitochondrial calcium transporters with EGF-induced EMT. Gene expression of A) SPCA1, B) SPCA2, C) MCU and D) NCLX with EGF-induced EMT was assessed using real-time RT-PCR. Bar graphs show mean ± S.D. for nine individual wells from three independent experiments. Statistical analysis was performed using an unpaired t-test.

