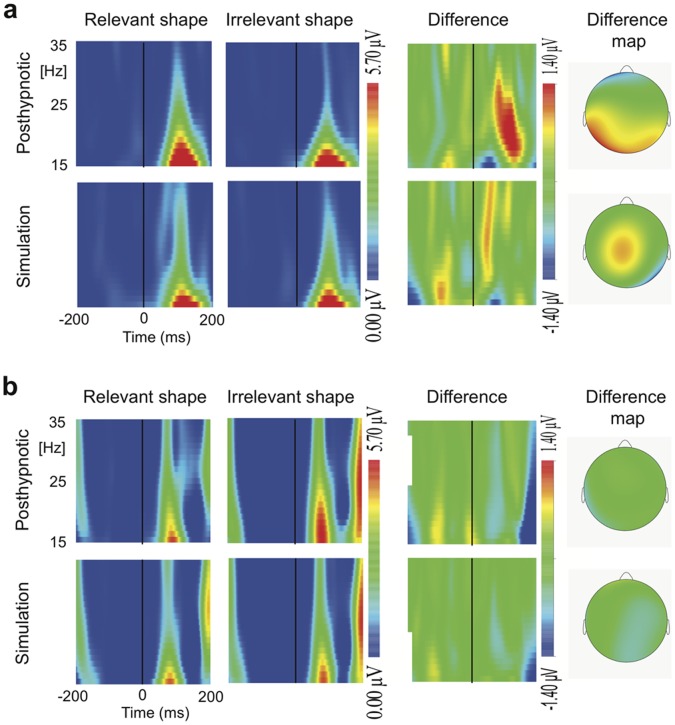
Figure 2. Evoked potential responses.
Time-frequency representations of the evoked responses to suggestion-relevant and -irrelevant shapes and their difference scalogram in the posthypnotic and simulation conditions at 15–35 Hz over the left occipital cortex for (A) TS-H and (B) RM. The maps on the right side show the scalp distribution of the shape related difference at the central frequency of 22 Hz in the 70–120 ms post stimulus time window.

