
Figure 5. Differences in gene expression profile between the DOL and NDOL.
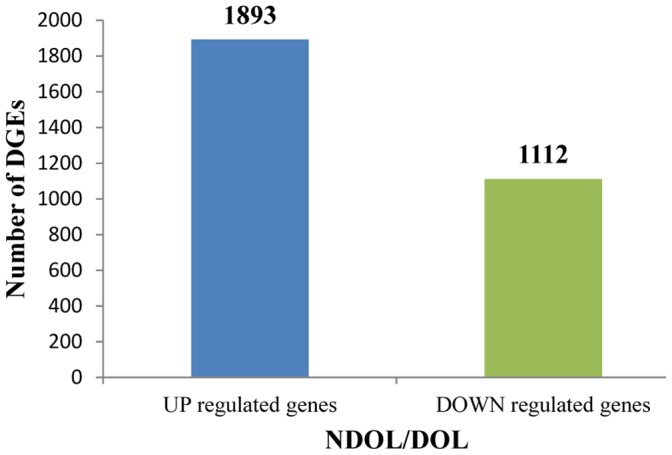
‘DGEs’ indicate unigenes with FDR ≤0.001 and an absolute value of log2Ratio ≥1. Numbers of genes up-regulated and down-regulated in the NDOL compared to DOL are indicated above the blue or green bars, respectively.