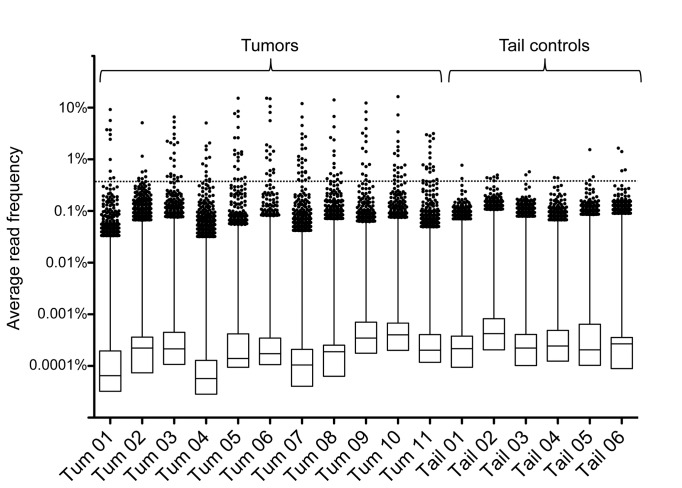
Figure 3. Tumors contain clonally expanded transposon insertions.
Box plot of average read frequencies of transposon insertions in tumors and tail controls. Dots show the top 1% insertions of each sample, ranked by average read frequencies. Vertical line indicates distribution of the 2-25% percentile group, and boxes indicate distribution of the lower 75% of insertions. A threshold for outliers (dotted horizontal line) was calculated by averaging the read frequencies of the top 10 insertions of each tail sample.

