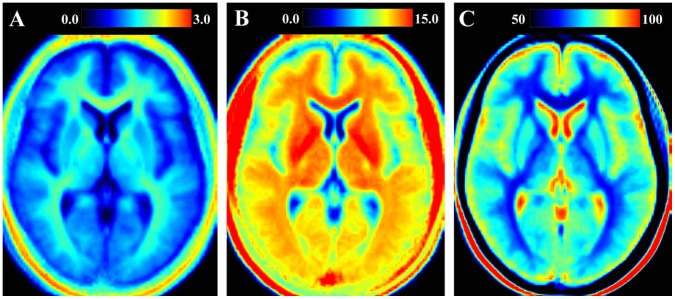
Figure 2. Example of the normalized qMRI reference maps in a slice through the brain.
The figure shows the reference maps obtained from images pooled across a group of 31 healthy subjects with A: R1 relaxation rate on a scale 0–3 s−1, B: R2 relaxation rate on a scale 0–15 s−1 and C: proton density on a scale 50–100%, where 100% corresponds to pure water at 37°C.

