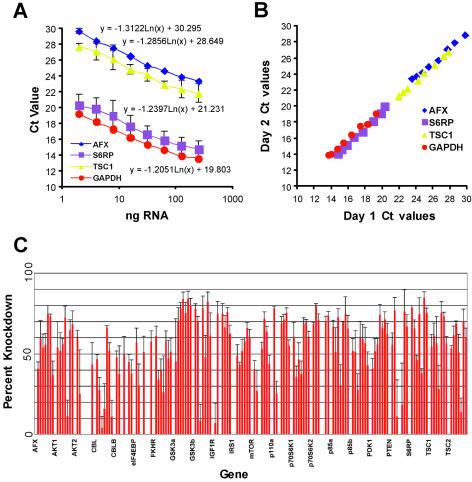
Figure 2.
mRNA knockdown achieved with siRNAs duplexes targeting the PI3K pathway. (A) Standard curves relating input nanograms of total RNA to Ct value for four different mRNA species (AFX, S6RP, TSC1 and GAPDH). The log-linear relationship holds constant despite significant abundance differences in the four genes. (B) Inter-assay variation in QRT-PCR for four mRNA species. In order to determine whether assays conducted on different days and indifferent runs could be accurately compared, we performed replicate experiments on different days as described in Materials and Methods. The x-axis reflects the Ct values obtained on day 1 while the y-axis reflects the Ct values obtained on day 2. (C) Percent knockdown of each duplex and pool directed against the inducted mRNAs as determined by QRT-PCR. The %KD was calculated as described in Materials and Methods using the standard curves derived in (A). The %KD is plotted along the y-axis for each siRNA and pool for the genes (as indicated) as shown along the x-axis.

