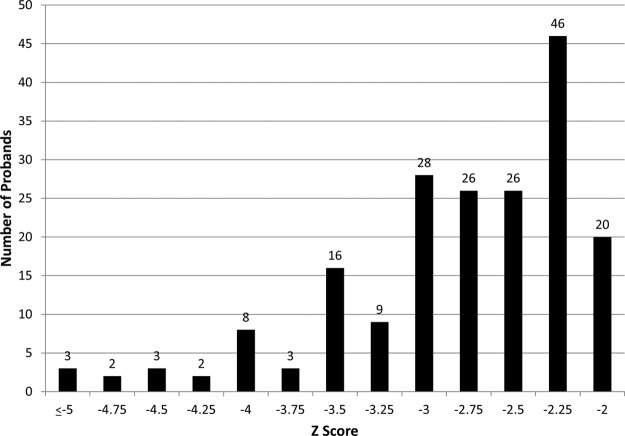
Figure 1.
Height z score at enrollment or before initiation of GH therapy. Each bar represents individuals with a height z score less than or equal to the number noted below it on the x-axis but greater than the number below the bar to the left. For example, the right-most bar represents individuals with a height z score −2.25 < z ≤ −2.

