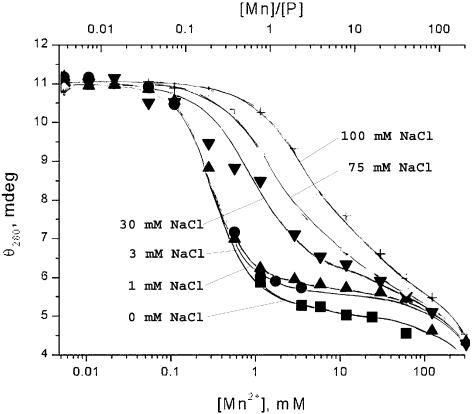
Figure 4.
Optical activity of DNA–Mn2+ complexes (ECD, elipticity θ at 280 nm in mdeg) versus MnCl2 concentration (mM, bottom scale), and molar ratio of Mn2+ to DNA phosphate (R, top scale) at different NaCl concentrations: square, 0 mM NaCl; round spot, 1 mM NaCl; triangle, 3 mM NaCl; inverted triangle, 30 mM NaCl; diamond, 75 mM NaCl; plus sign, 100 mM NaCl.

