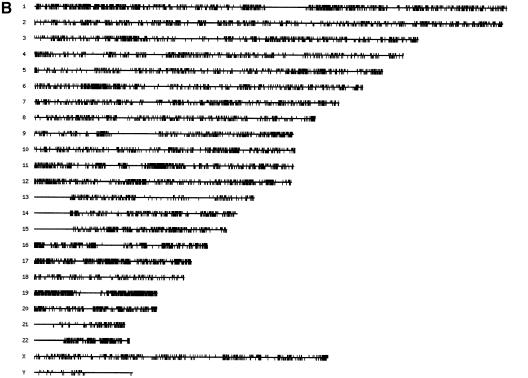
Figure 1.
Distribution of the PPRs in the human genome. (A) The positions of the TSS from the 4737 PPRs on each chromosome (horizontal lines) are represented as vertical bars. The vertical lines above the chromosome lines correspond to TSSs mapped in the positive chromosome orientations; and those below, the negative chromosome orientations. (B) The location of the 5′ end of 18 372 reviewed RefSeq transcripts present in NCBI build 33 and obtained from ftp://ftp.ncbi.nih.gov/genomes/H_sapiens/RNA/rna.fa.gz.


