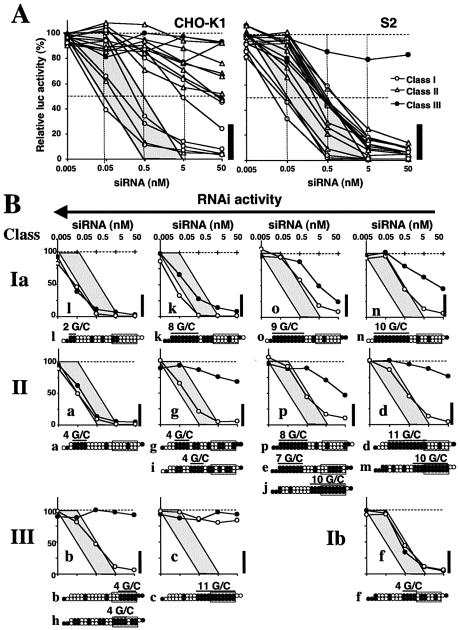
Figure 4.
Dose dependency of RNAi effects in CHO-K1 and S2 cells. The shaded area is the region bounded by two lines, intersecting, respectively, with the horizontal axis at 0.5 and 5 and the 50% line of luc activity at 0.05 and 0.5. The thick vertical bar at the right of each panel indicates the region with >77% reduction in luc activity. (A) Change in luc gene silencing activity with siRNAs ranging from 0.005 to 50 nM in CHO-K1 (left) and S2 (right) cells. siRNAs a–p in Figure 1 are grouped into three classes, I (open circles), II (open triangles) and III (closed circles). (B) Direct comparisons of RNAi activity curves in S2 (open circles) and CHO-K1 cells (filled circles). The sequences of corresponding or similar siRNAs are schematically shown in the lower margin. siRNAs i, e, j, m and h behave the same way as their corresponding examples above. Filled circles, G/C; open circles, A/U. The 7 bp duplex region containing the 5′ end is boxed. Eleven pictures are positioned based on siRNA classification and induced RNAi activity levels.

