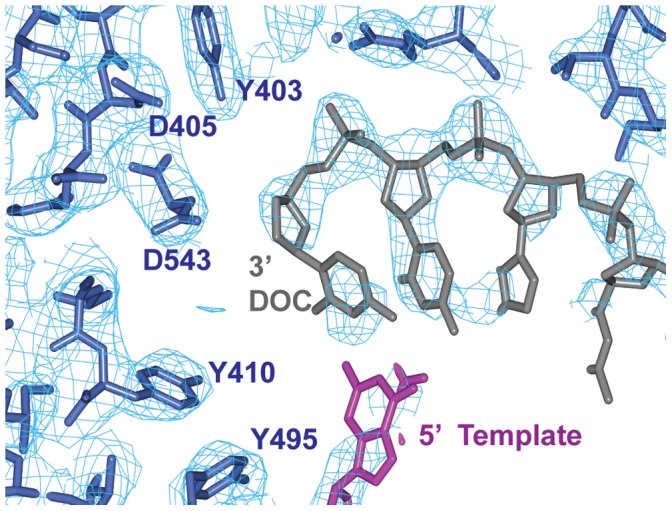
Figure 5. Density for the DNA and active site in the Pfu-E10:DNA binary complex.

An omit map was calculated omitting the co-ordinates of the DNA. This map, contoured at 1.25 sigma is shown in pale blue, with the DNA primer and terminal dideoxy cytidine (DOC) in grey, the DNA template in magenta, and Pfu:E10 residues in dark blue.
