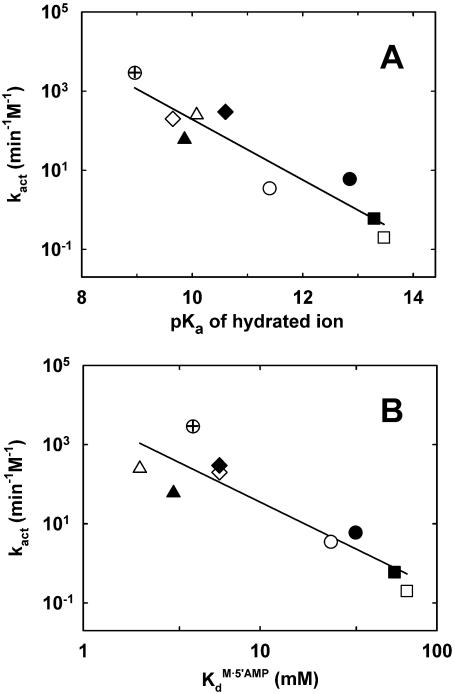
Figure 3.
Correlations between kact and some physico-chemical properties of the activating divalent metal ions (represented by different symbols: Mg2+, open circles; Ca2+, closed circles; Ba2+, open squares; Sr2+, closed squares; Co2+, open diamonds; Mn2+, closed diamonds; Cd2+, open triangles; Ni2+, closed triangles; Zn2+, crossed circles). (A) Correlation between kact and the pKa of the hydrated metal ion. pKa values were taken from Richens (47). The solid line represents a linear least-squares fit of the data, with slope = –0.76 ± 0.1 and R2 = 0.87. (B) Correlation between kact and the affinity of the metal ions for 5′AMP. The values of KdM·5′AMP (the dissociation constant of the metal–5′AMP complex) were obtained from Massoud and Sigel (48). The solid line represents a linear least-squares fit of the data, with slope = –2.2 ± 0.4 and R2 = 0.81.

