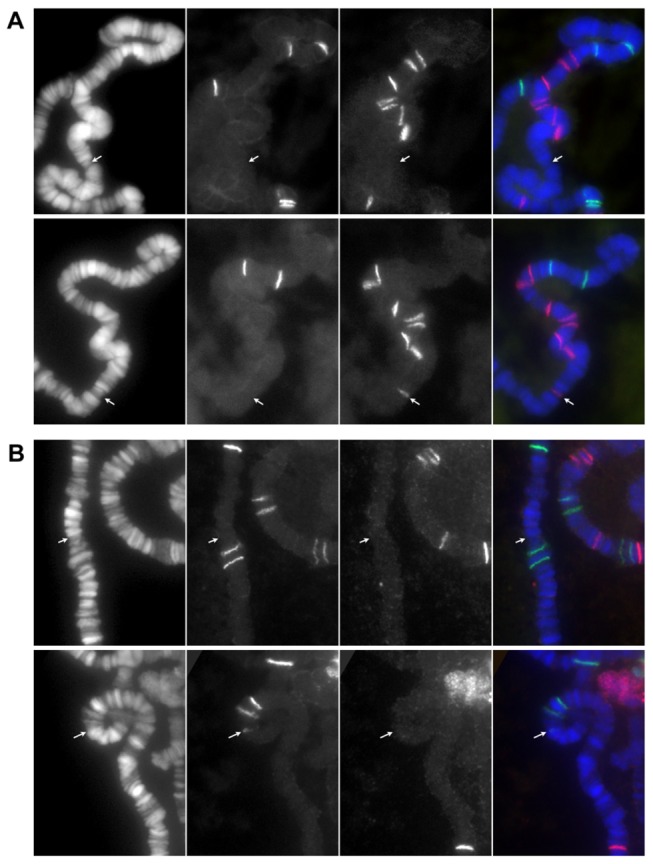
Figure 2. Examples of detected somatic transpositions.

(A) A new DOC band is shown at 3R: 88C in a cell of a dcr2[CY]/+ larva (bottom row) but not in another cell from the same pair of salivary glands (top row). (B) Similarly a new 297 band is shown at 3R: 86C in a cell of a dcr2[GE]/[CY] larva but not in its sister cell (upper row). Each row shows three color channels of blue, green and red in order from left to right and a merged image in the very right. The arrows point to the positions of the new bands.
