
Figure 3. The ago2 and dcr2 mutations caused increased transposition of 297 and DOC.
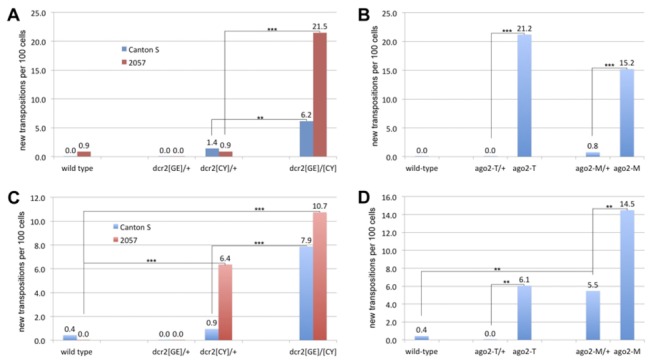
The somatic transposition rate of both elements was measured in wild type, heterozygous mutant and homozygous mutant in the 2057 or Canton S backgrounds as the number of events per 100 cells. (A) 297 somatic transposition rate with dcr2 mutations in both backgrounds. (B) 297 somatic transposition rate with ago2 mutations in the Canton S background. (C) DOC somatic transposition rate with dcr2 mutations in both backgrounds. (D) DOC somatic transposition rate with ago2 mutations in the Canton S background. Paired comparisons for significance of difference are shown in each chart, and “**” indicates p <0.01 and “***” indicates p<0.001.