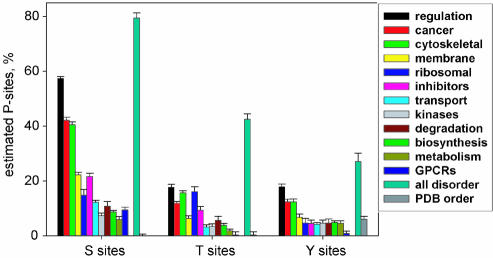
Figure 5.
Estimated percentages of S, T and Y phosphorylation sites in 12 functional protein categories from SWISS-PROT and in disordered and ordered data sets. The y-axis indicates the estimated percentage of phosphorylated S, T or Y residues in each data set. The data set ‘all disorder’ consisted of disordered protein regions characterized by X-ray diffraction (extracted from PDB-Select-25), NMR and CD (extracted from the literature). The data set ‘PDB order’ consisted of the ordered protein regions with known 3D structure extracted from PDB. The error bars correspond to 1 SD.

