Figure 1.
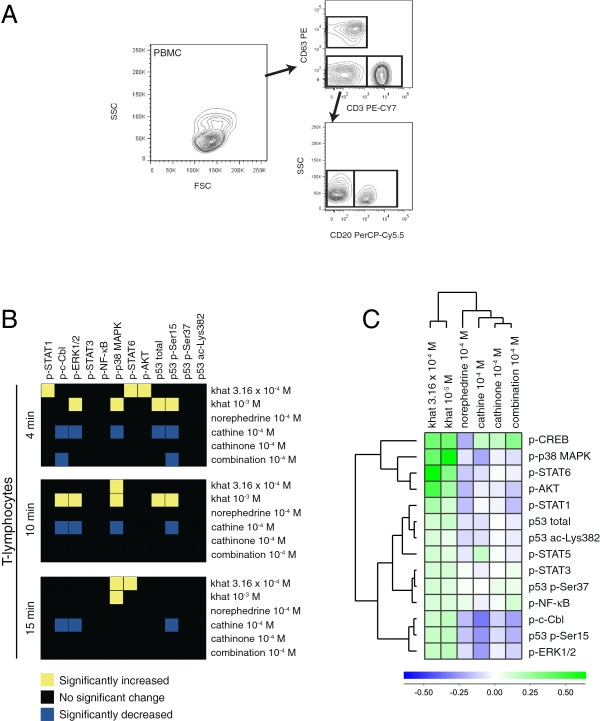
Gating strategies and signal transduction in T-lymphocytes. PBMCs (n = 6) were stimulated with khat-extract (10-3 and 3.16 × 10⁻⁴ dilutions), cathinone, cathine, norephedrine (10-4 M) and a combination of cathinone and norephedrine (combination: 2 × 10⁻⁴ M) for 4, 10 and 15 minutes, in vitro. (A) The PBMCs were fixed, permeabilized, stained with antibodies against specific cell surface markers and modification-specific antibodies and analyzed by flow cytometry. The PBMCs were identified as T-lymphocytes (CD3+ CD20- CD163-), B-lymphocytes (CD3- CD20+ CD163-), NK cells (CD3- CD20- CD163-) and monocytes (CD3- CD20- CD163+). (B) Heatmaps of statistical significant changes in protein-modification levels and total protein levels in T-lymphocytes. The analysis is based on fold change values for the modification-specific antibodies calculated from MFI measurements: MFIstimulated/MFIcontrol. ANOVA of the mean was used to determine statistical significant changes. (C) Unsupervised hierarchical clustering analysis of the different stimuli and signal transduction proteins in T-lymphocytes following 15 minutes of stimulation. The mean fold changes were calculated, and log(2) converted before the unsupervised hierarchical clustering analysis was performed.

