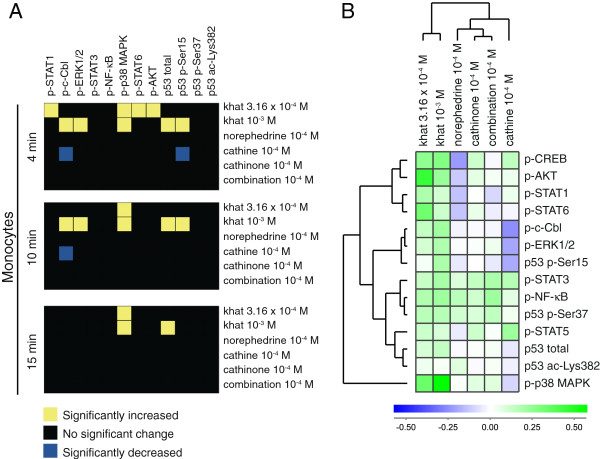
Figure 4.
Signal transduction in monocytes. (A) Heatmap of statistical significant changes in protein-modification levels and total protein levels in monocytes. (B) Unsupervised hierarchical clustering analysis of the different stimuli and signal transduction proteins in monocytes following 15 minutes of stimulation.

