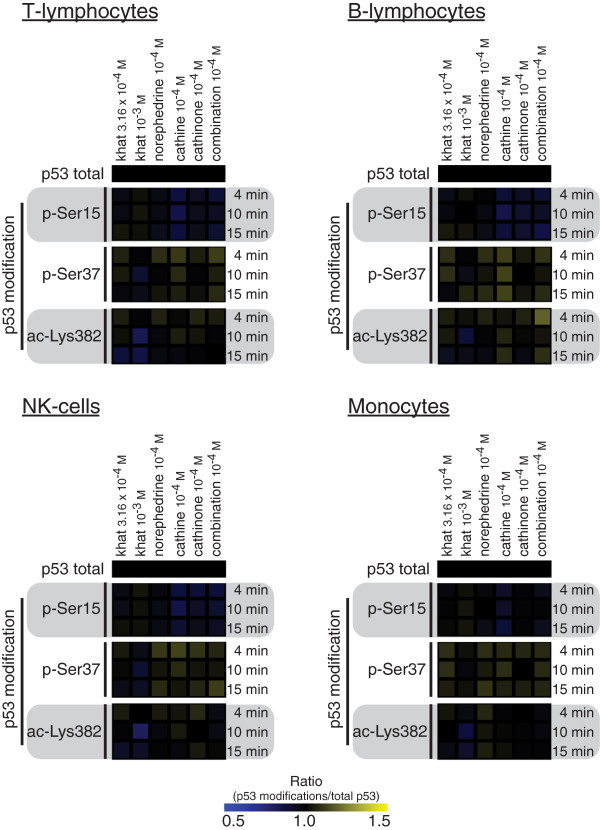
Figure 5.
p53 post-translational modifications relative to total p53. Experiments and flow cytometry analyses as in the legend to Figure 1. Based on MFI values the median ratio of p-Ser15, p-Ser37 and ac-Lys382 relative to total p53 levels were determined for the various stimuli and time-points for the different leukocyte subsets.

