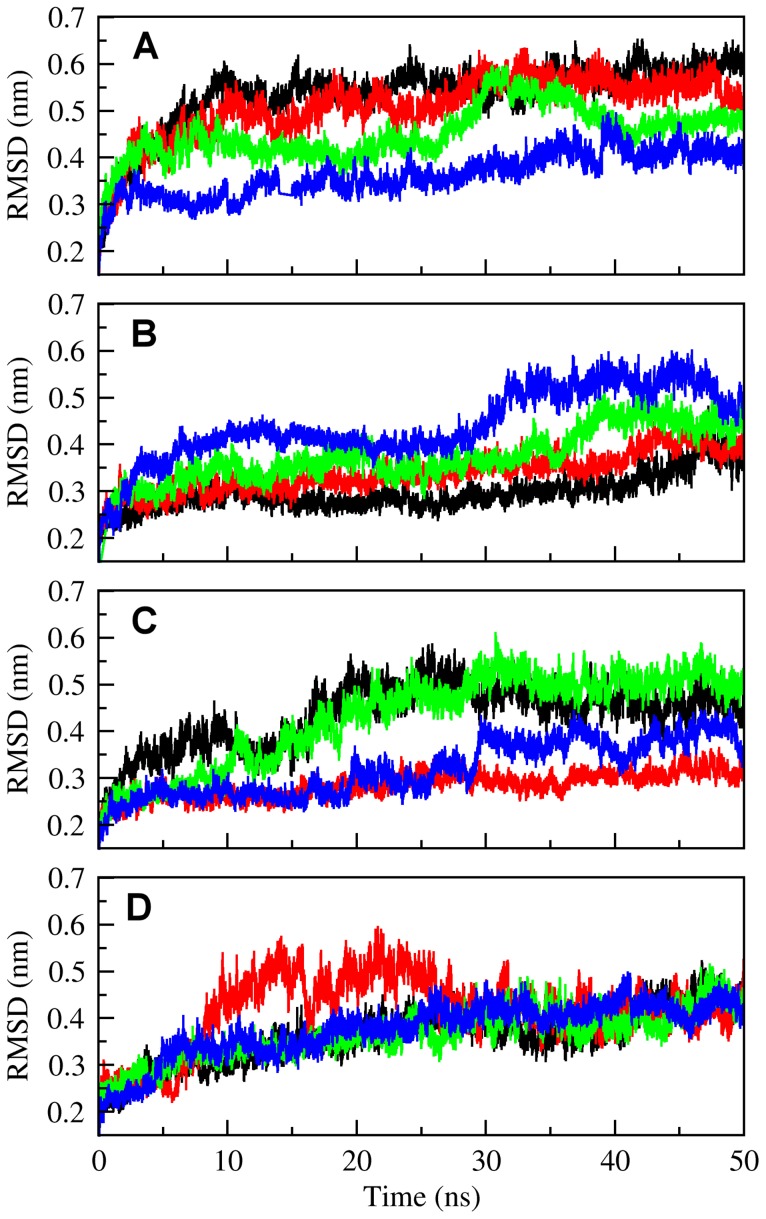
Figure 3. All-atom root-mean-square deviation (RMSD) of the protein, plotted against the 50 ns MD simulation time, for the systems containing (A) the NST alone and for the (B) NST/PAPS, (C) NST/PAPS/α-GlcN-(1→4)-GlcA and (D) NST/PAP/α-GlcNS-(1→4)-GlcA complexes.
Black, NST-1; Green, Lys614Ala; Blue, His716Ala, Red, Lys833Ala.

