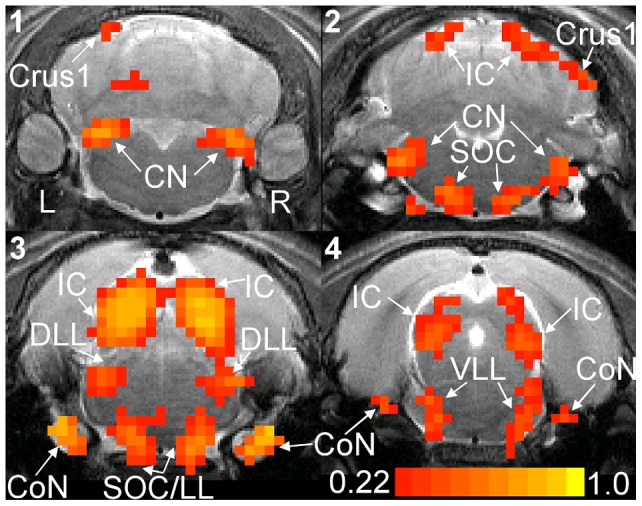
Figure 2. Correlation coefficient map.

Correlation coefficient (r) map computed from the average spin-echo echo planar imaging images of a representative animal. Averaging was performed across the seven ILDs. The left and right hemispheres of the brain are labeled. The image slices are labeled one to four and the distances from their centers to Bregma are 10.9, 9.7, 8.5, and 7.3 mm, respectively. Groups of activated voxels with r >0.22 and in clusters of three voxels are color coded and can be found in the cochlear nerve (CoN), cochlear nucleus (CN), superior olivary complex (SOC), dorsal lateral lemniscus (DLL), ventral and intermediate lateral lemnisci (VLL), inferior colliculus (IC), and crus1 of the ansiform lobule of the cerebellum (Crus1). Regions of interest (ROIs) are drawn around activated voxels in the CN, SOC/LL, DLL, and IC of both hemispheres. Identification of different voxel groups was aided by the rat brain atlas. SOC/LL refers to a group of voxels that covers parts of the SOC and lateral lemniscus.
