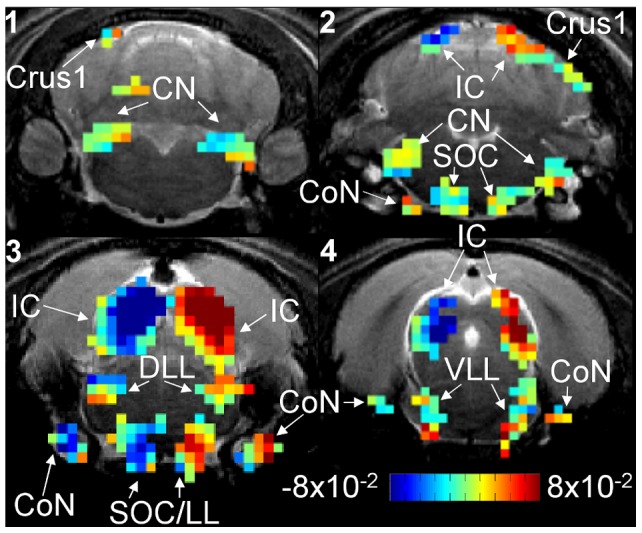
Figure 4. BOLD signal ratio slope map.

BOLD signal ratio slope map computed (refer to methods for computation details) from the animal in Figs. 2 and 3. Slope is color coded from −8×10⁻²%/dB to 8×10⁻²%/dB and only activated voxels in Fig. 2 are color coded. Positive slope indicates the signal is greater at positive ILDs or when left ear SPL is greater than right ear SPL. Similarly, negative slope indicates the signal is greater at negative ILDs. Negative slope voxels are located in the left hemisphere CoN, SOC/LL, DLL, and IC and the right hemisphere CN. Positive slope voxels are located in the right hemisphere CoN, SOC/LL, DLL, and IC and left hemisphere CN.
