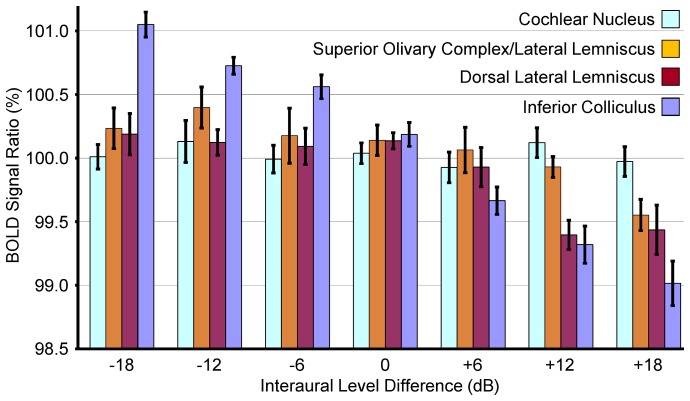
Figure 5. BOLD signal ratios for different structures and ILDs.
Mean and standard error (across all animals) of BOLD signal ratios computed for each structure with the ROIs in Fig. 2. The ratios were computed at each ILD by dividing the BOLD signal in the left hemisphere ROI by that in the right hemisphere ROI. The units are percentage of right hemisphere signal. A ratio of 100% indicates equal signal in the two hemispheres. The SOC/LL, DLL, and IC ratios exhibit a trend of decreasing ratio from −18dB to +18dB ILD while the CN ratio does not exhibit significant changes with ILD.

