
Figure 4.
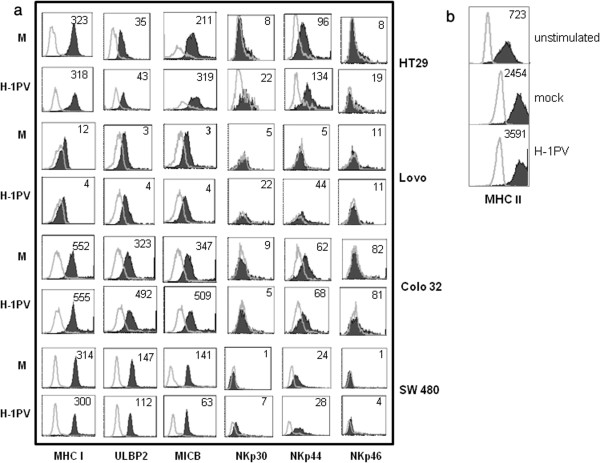
Effect of H-1PV infection on the phenotype of colon carcinoma and dendritic cells. (a) Colon carcinoma cells were buffer-treated (M) or H-1PV-infected (MOI=5 RU per cell), incubated for 24 h, and analyzed by flow cytometry for expression of MHC class I, MICB, and ULBP 2 molecules and NCR (NKp30, NKp44, and NKp46) ligands. Control mouse IgG and specific antibody staining profiles are shown by gray lines and black columns, respectively. The indicated values represent ∆MFI=MFI (positive)-MFI (isotype/negative control) for one representative experiment out of three. (b) Colo32 cells were mock-treated (M) or H-1PV-infected (MOI= 5RU/cell) and lysates prepared on day 1 p.i. Dendritic cells were then pulsed with lysate for 2days and thereafter, analyzed for expression of MHC class II molecules, and compared with untreated dendritic cells. Figure 4(b) shows the means of data obtained from 3 donors. Control mouse IgG and specific antibody staining profiles are shown by grey lines and black columns, respectively. The indicated values represent ∆MFI = MFI (positive)-MFI (isotype/negative control).