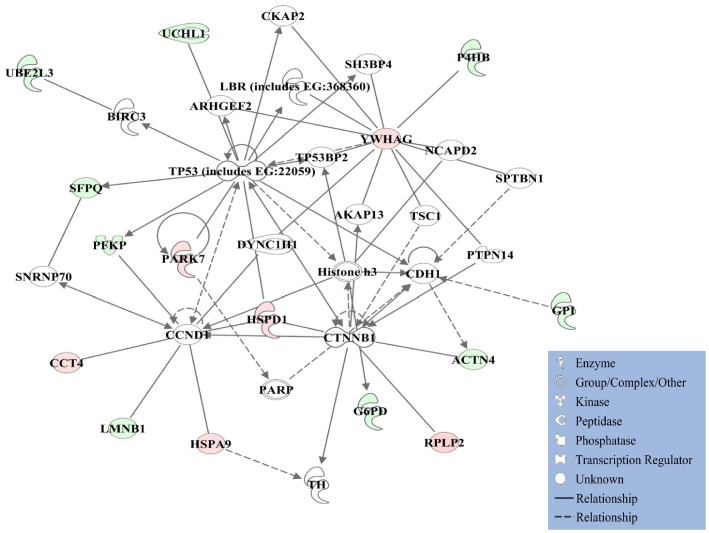
Figure 1. Ingenuity Pathway Analyses (IPA).
Proteins with significant differential expression regulate a network of cell-to-cell signaling and interaction, cellular growth and proliferation, as well as cellular development. Red shading: upregulated in VHL-mut RCC; green shading: downregulated in VHL-mut RCC. Protein–protein interactions from the network diagram are represented by single lines and proteins/compounds that regulate another protein are indicated by arrows. Solid or dashed lines indicate direct or indirect interactions, respectively. The various shapes represent different protein functions.

