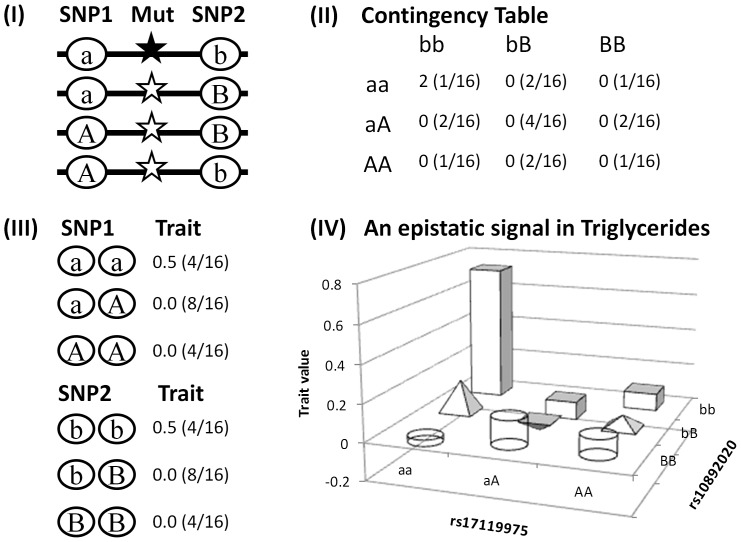
Figure 2. A cartoon model illustrating a haplotype tagging a recessive causal variant can generate an apparent statistical interaction between two unlinked SNPs each with limited marginal effects.
(I) A recessive causative variant (black star) is associated with only the ab SNP haplotype, assuming Hardy-Weinberg Equilibrium, i.e. an equal allele frequency of 0.5 for each SNP so there is no LD between the two SNPs and an equal frequency of 0.25 for each of the four possible haplotypes, and the causal variant with an effect size of 1. (II) Only individuals homozygous for this haplotype (ab/ab) are genetically differentiated generating apparent epistasis (averaged trait value and joint genotype frequency in the bracket in each cell). (III) Marginal effects associated with the individual SNPs are limited with only one in four individuals of the aa or bb SNP genotype being affected with a trait value of 2 so the averaged trait value of the genotype is 0.5 (SNP genotype frequency in brackets), thus the individual SNPs may not be detected by a conventional GWAS. (IV) This resembles the interaction between rs17119975 and rs10892020 in TRI (Table 1) where neither SNP had important marginal effects and their interaction signal was mainly because of the differentiated phenotype associated with the double homozygous aabb genotype.

