
Figure 3. Downregulation of ERManI inhibits transformation phenotypes of PLC/PRF5 cells.
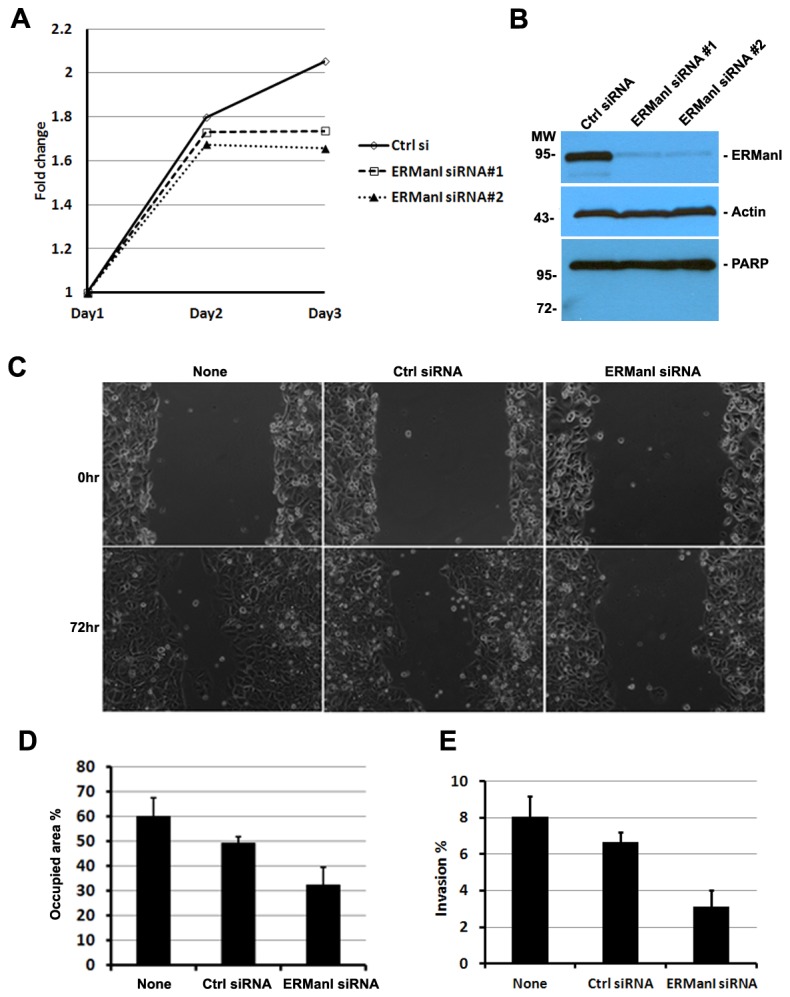
A. Growth curve of PLC/PRF5 cells after transfection with control siRNA or two separate ERManI siRNAs #1 and #2 for 3days. B. Phase contrast images of non-transfected PLC/PRF5 cells or PLC/PRF5 cells transfected with control siRNA or ERManI siRNA at 0hr or 72hr after wound scratching. C. Average of the wounded areas occupied by non-transfected or siRNA-transfected PLC/PRF5 cells at 72hr post-scratching. Error bars represent standard deviations. D. Non-transfected PLC/PRF5 cells or PLC/PRF5 cells transfected with control siRNA or ERManI siRNA were subjected to the invasion assay, and the percentage of invaded cells were calculated against the total number of cells seeded. Error bards represent standard deviations from three repeated samples.