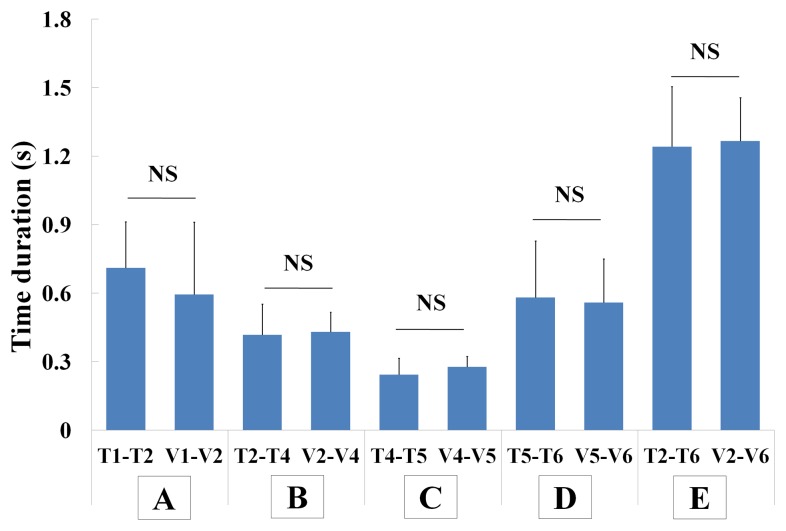
Figure 4. Comparisons of duration of time points and VF events.
A indicates the comparison of T1–T2 and V1–V2, B indicates the comparison of T2–T4 and V2–V4, C indicates the comparison of T4–T5 and V4–V5, D indicates the comparison of T5–T6 and V5–V6, and E indicates the comparison of T2–T6 and V2–V6. NS, p>0.05.

