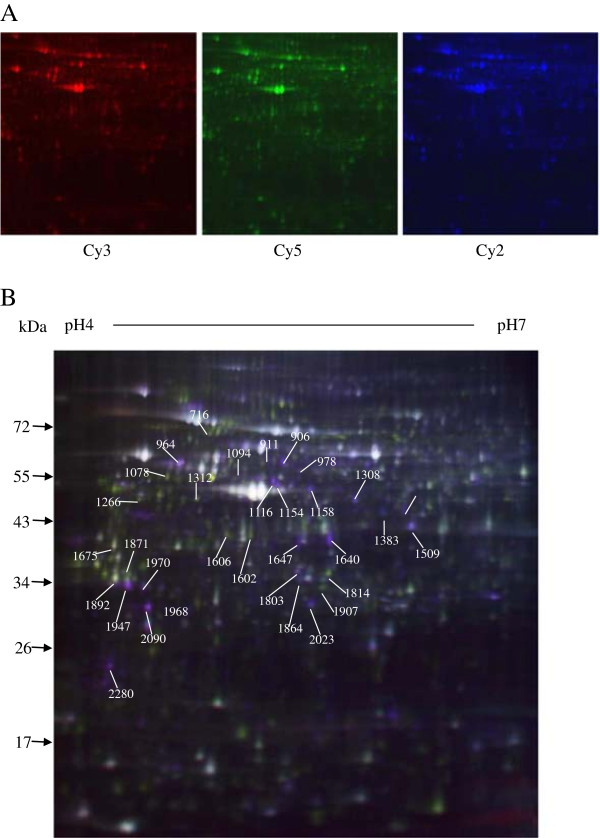
Figure 2.
Differentially expressed protein spots (marker with master numbers) displayed in 2D DIGE images. The TGEV-infected ST cell lysates are labeled with Cy3 (red), the mock-infected ST cells are labeled with Cy5 (blue), the internal standard proteins are labeled with Cy2 (yellow) (A). Representative data from a 2D DIGE (B).

