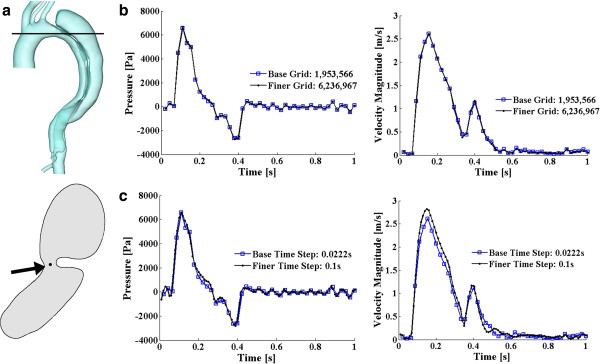
Figure 3.
Grid and time step sensitivity study. (a) displays the studying point: the upper panel shows the cutting slice, and the lower one is the shape of that slice (viewing from the top) with an arrow pointing towards the studying point. (b) and (c) display the pressure and velocity magnitude variations at that point for grid independency study and for time step sensitivity study, respectively.

