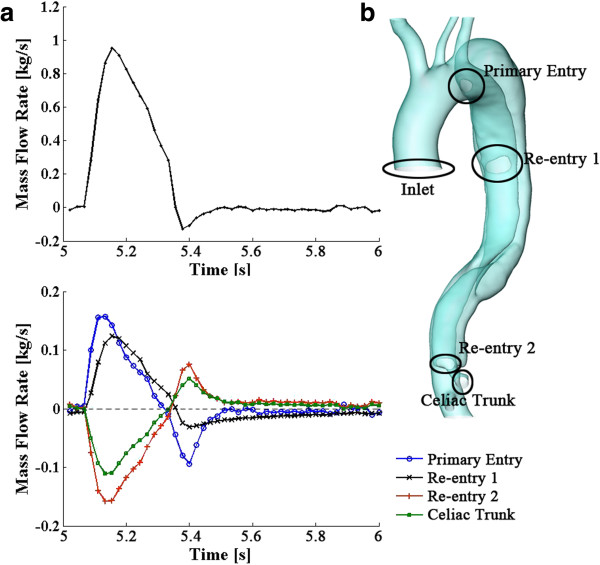
Figure 5.

Mass flow rate over a cardiac cycle (5~6 s). The upper panel of (a) displays the mass flow rate at the inlet; while, the lower panel represents the variations of the mass flow rate at the three entries and the outlet of the celiac trunk; (b) represents the positions of the entries, the inlet of the aorta, and the outlet of the celiac trunk.
