
Figure 7.
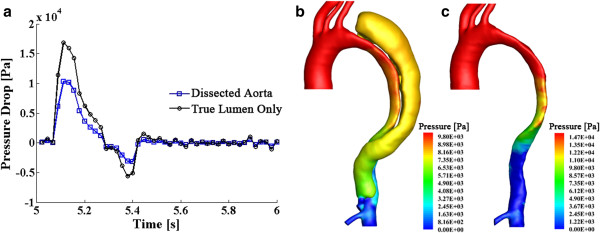
Pressure drop curves over a cardiac cycle and the pressure distribution at systolic peak. (a) displays the time-various pressure drop curves, which measure the pressure difference from the inlet at the ascending aorta to the end of the thoracic aorta; (b) and (c) respectively displays the pressure distribution at systolic peak for the dissected aorta and for the true lumen only.