
Figure 8.
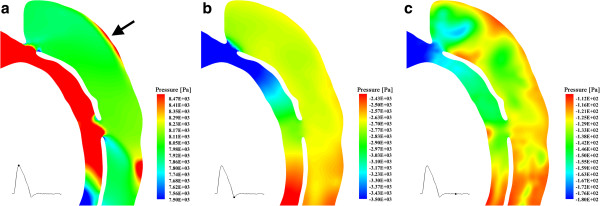
Pressure distributions along a slice that crosses primary entry and re-entry 1. The small image on the left bottom of each picture is the cardiac pulse wave, and the point on it indicates the time of the corresponding snapshots.
Official websites use .gov
A
.gov website belongs to an official
government organization in the United States.
Secure .gov websites use HTTPS
A lock (
) or https:// means you've safely
connected to the .gov website. Share sensitive
information only on official, secure websites.
Pressure distributions along a slice that crosses primary entry and re-entry 1. The small image on the left bottom of each picture is the cardiac pulse wave, and the point on it indicates the time of the corresponding snapshots.