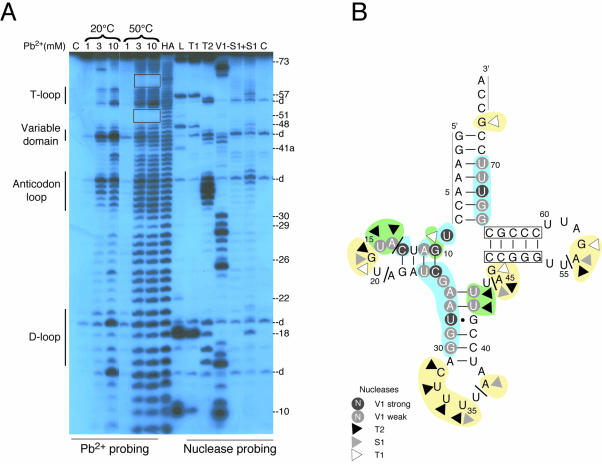
Figure 3.
Probing of tRNAPyl transcript. (A) Autoradiogram of a 12% denaturing gel of probing experiments on 5′-labelled M.barkeri tRNAPyl(UUU) transcript. Experiments using Pb2+ were conducted at 20 and 50°C (left part). Final concentrations of Pb2+ are indicated. Experiments with RNases T1, T2, V1 and S1 were conducted at 20°C (right part). Control incubations (C) were run in parallel. Lane –S1 checks the effect of ZnCl2 present in nuclease S1 buffer, lane AH represents an alkaline ladder and lane L represents a denaturing RNase T1 ladder. Numbering defines the position of G residues. T-, anticodon and D-loops and the variable domain are indicated. (B) Summary of the probing experiments displayed on the tRNAPyl cloverleaf. Lines at the 3′- and 5′-ends indicate untested regions. Nucleotides cut by nuclease S1, T1 and T2 are indicated by triangles. Cuts generated by RNase V1 are emphasized by white letters on grey or black backgrounds corresponding to weak and strong cleavages, respectively. Yellow areas correspond to nucleotides cut by probes specific of single-stranded regions and by Pb2+ at low temperature. Blue areas correspond to nucleotides cut by probes specific of double-stranded regions and by Pb2+ at high temperature. Regions cut by both types of enzymatic probes are in green. Regions resistant to Pb2+ cuts are boxed. Strokes indicate positions of spontaneous degradations.

