
Figure 2.
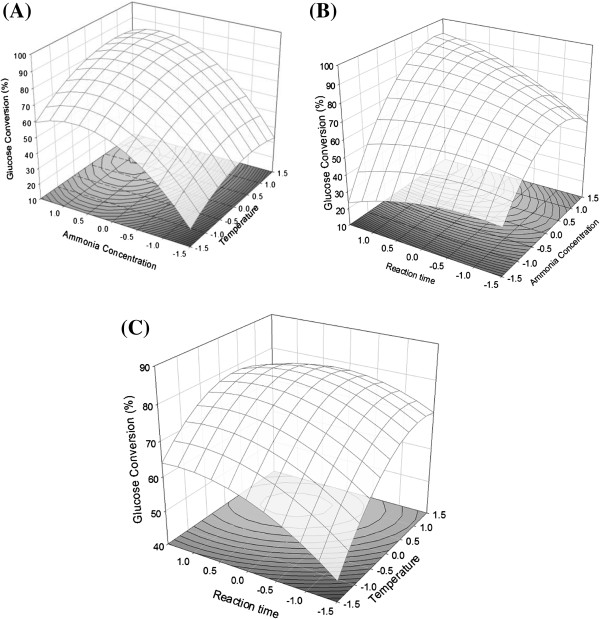
Response surface plots of effect of each factor on glucose yield from soaking in aqueous ammonia process. (A): Effects of temperature and aqueous ammonia concentration; (B): Effects of aqueous ammonia concentration and reaction time; (C): Effects of temperature and reaction time.