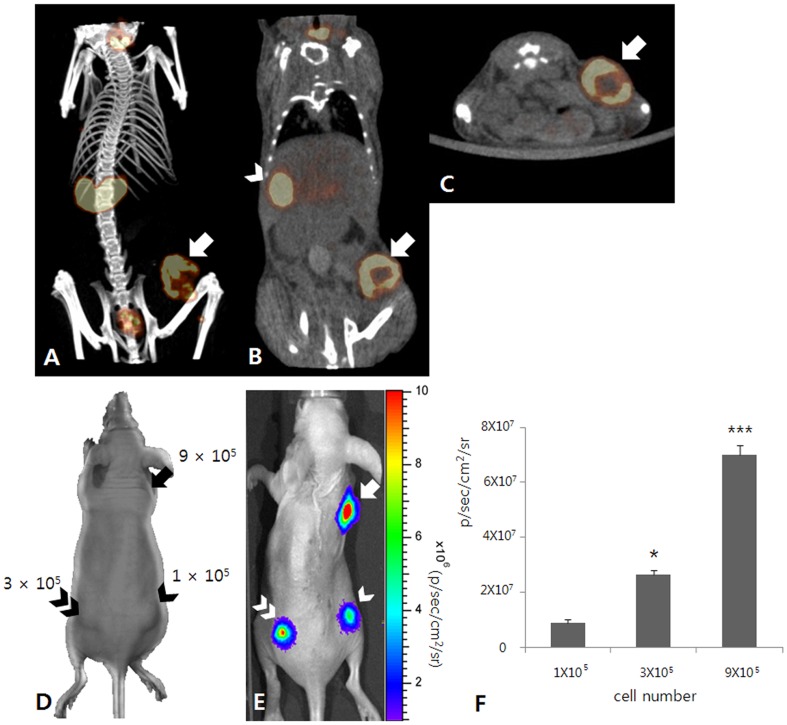
Figure 3. Characterization image of MDA-231/NF cells.
(A–C) Tc-99m pertechnetate SPECT/CT images show focal tracer uptake (arrow) in the right flank of the MDA-231/NF tumor xenograft. There is also noted tracer uptake at the stomach (arrow head). (D–F) In vivo bioluminescence imaging for a mouse with MDA-231/NF cell implantation. (D) MDA-231/NF cells were implanted subcutaneously into the right hind-flank (1×10⁵; arrow head), left hind-flank (3×10⁵; double arrow head), and right fore-flank (9×10⁵; arrow) of the mouse. (E) Bioluminescence signals from implanted MDA-231/NF cells are clearly visualized in the right hind-flank (arrow head), left hind-flank (double arrow head), and right fore-flank (arrow). (F) The signal intensity from tumor cells increased with increasing cell number. * p<0.05 compared with 1×10⁵ cells, *** p<0.001 compared with 1×10⁵ and 3×10⁵ cells.

