
Figure 2.
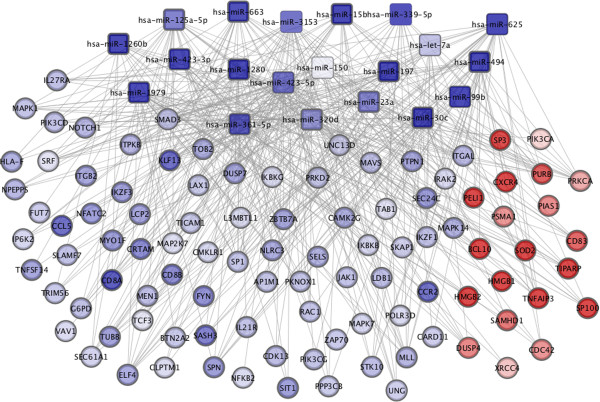
A computational method to identify microRNA function and mRNA targets in T-cells. Target genes of significantly regulated microRNA between MS patients and controls, using TargetScan and Miranda algorithms, were compared with significantly differently expressed mRNA from peripheral blood T-cells between patients and controls. Squares indicate microRNA and circles mRNA. Red indicates increased expression and blue decreased expression between MS patients and controls.