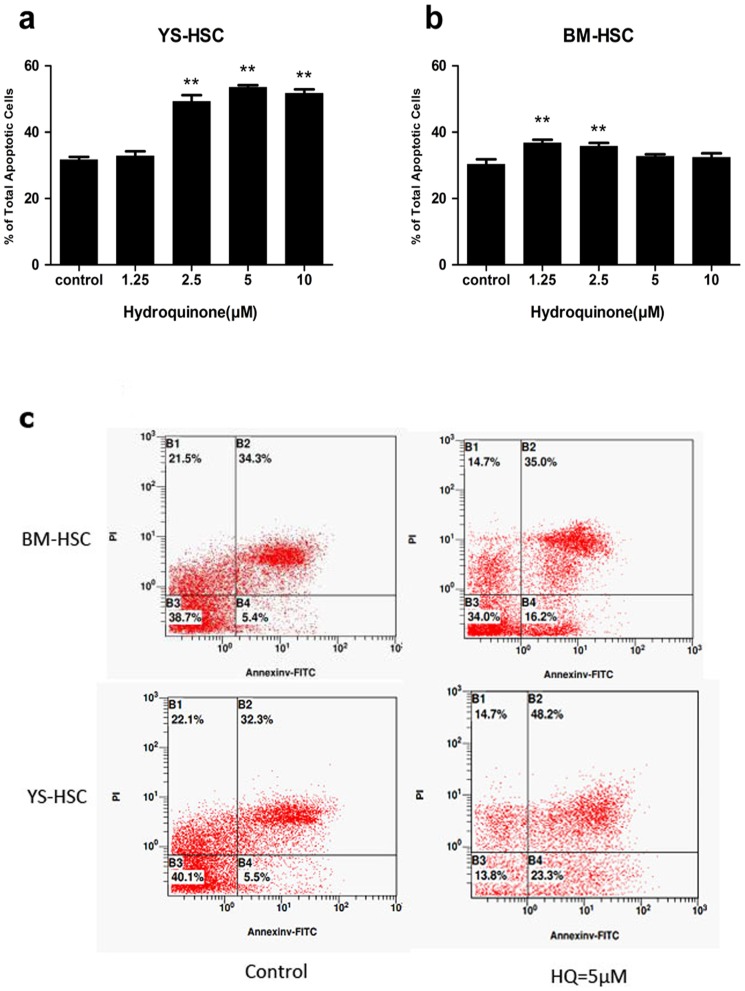
Figure 5. Comparison of apoptotic effects of HQ on BM-HSC and YS-HSC.
Cells were exposed to various concentrations of HQ after 24 h liquid culture and were stained with Annexin V and PI. Apoptosis was determined using flow cytometry as described in Materials and Methods. Illustrated is a representative of three separate experiments. (a) Percent of total apoptotic cells of YS-HSC. (b) Percent of total apoptotic cells of BM-HSC. (**P<0.01, compared to control group values). (c) A representative flow cytometry data showing apoptotic effects of HQ on BM-HSC and YS-HSC at the 5 µM concentration.

