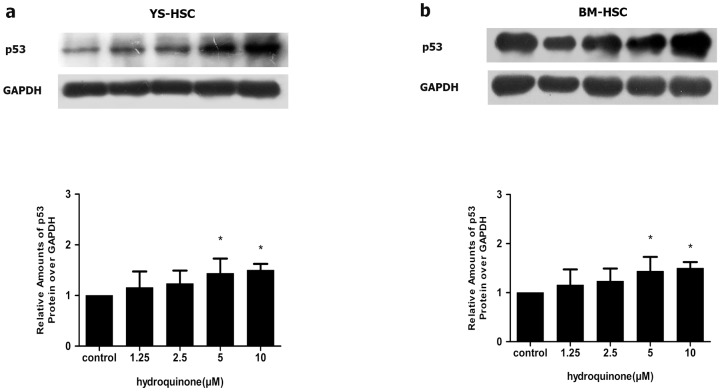
Figure 6. Induction of p53 by HQ.
YS-HSC (a) and BM-HSC (b) were treated with increasing concentrations of HQ for 24 h. Total cell lysates were analyzed by immunoblotting with antibodies against p53. Expression of the GAPDH protein was used as a loading control. Upper panels: representative blotting results. Densitometry of the immunoblotting results was shown in the lower panels. Values are presented as means ± SDs (n = 3–5). * P<0.05.

