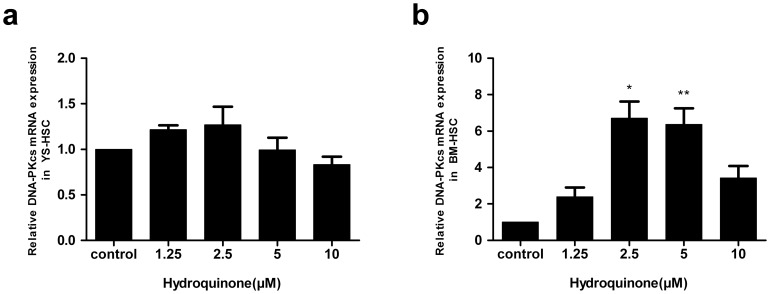
Figure 9. Effect of hydroquinone on DNA-PKcs mRNA expression.
YS-HSC (a) and BM-HSC (b) cells were treated with HQ at increasing concentrations and expression of DNA-PKcs mRNA was measured by quantitative real–time PCR. The relative expression of target genes was calculated using the 2−ΔΔCt method. Data represent means ± SDs of at least three individual experiments (*, P<0.05; **, P<0.01; and #, P<0.001; compared to control group values.).

