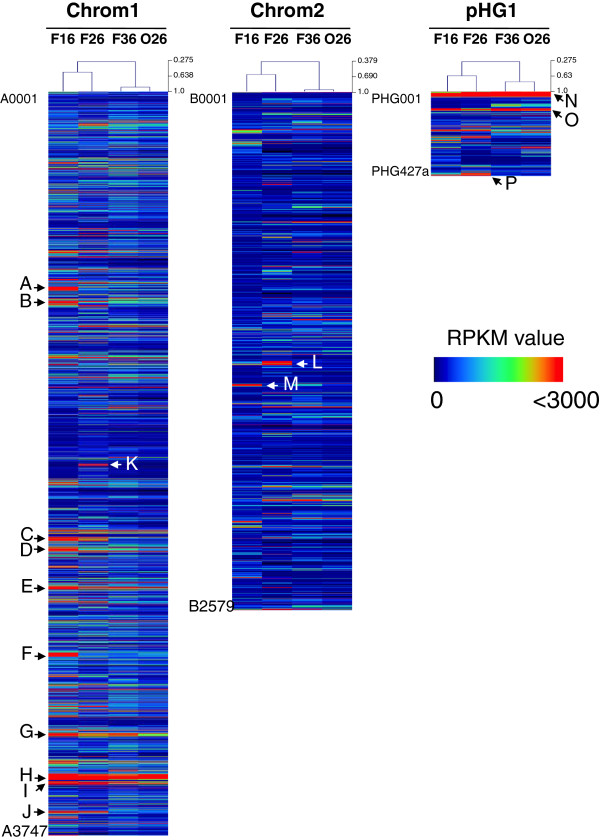
Figure 2.
Heatmaps of transcriptomes in R. eutropha H16 in different phases. The expression pattern is shown by the color scale based on RPKM value of each gene on chromosome 1 (left), chromosome 2 (center), and pHG1 (right), except for rRNA- and tRNA-coding genes and non-significant genes in expression (P > 0.05). The arrows A-P indicate highly expressed clusters.

