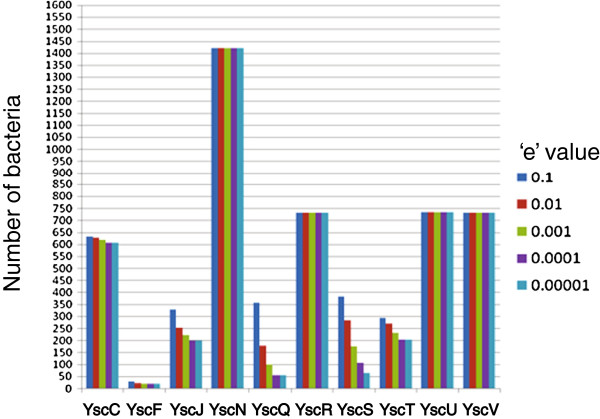
Figure 2.
Frequency of occurrences of individual T3SS proteins in bacterial genome. The homologues of each of the T3SS proteins have been predicted in bacterial genomes at different ‘e’ values. The numbers are plotted as a bar diagram. The colour codes used for different ‘e’ values are shown in the figure. ‘e’ values of 0.1, 0.01, 0.001, 0.0001, 0.00001 are shown in dark blue, red, green, magenta and light blue respectively.

