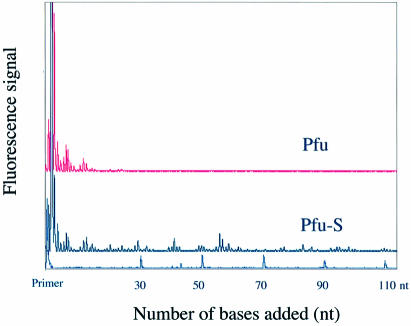
Figure 3.
Electropherogram traces of Pfu and Pfu-S for the processivity analysis. Size markers and the corresponding primer extension product length are shown at the bottom. The polymerase concentrations were 16 pM for Pfu and 80 pM for Pfu-S. The reaction buffer for both enzymes contained 20 mM Tris–HCl (pH 8.8), 10 mM KCl, 10 mM (NH4)2SO4, 0.1% Triton X-100 and 100 µg/ml BSA. The reaction time was 5 min.

