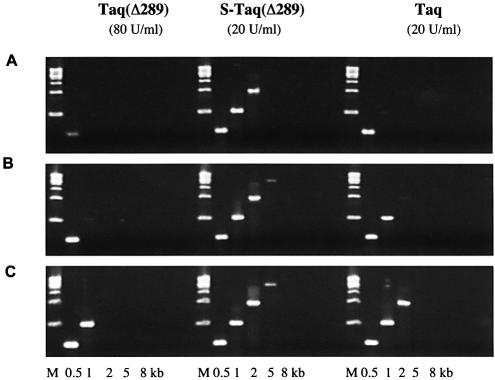
Figure 5.
Comparison of PCR efficiency of Taq, Taq(Δ289) and S-Taq(Δ289). λ DNA (130 pg/µl) was used as the template and the sizes of the amplicons are indicated at the bottom. The PCR buffer contained 10 mM Tris–HCl pH 8.8, 2 mM MgCl2, 200 µM each dNTPs and 0.1% Triton-100 with 10 mM KCl for Taq(Δ289) and 50 mM KCl for S-Taq(Δ289) and Taq. The cycling protocol was: 95°C for 20 s; 20 cycles of 94°C for 5 s and 72°C for 30 s (A) or for 60 s (B) or for 2 min (C); 72°C for 7 min.

